
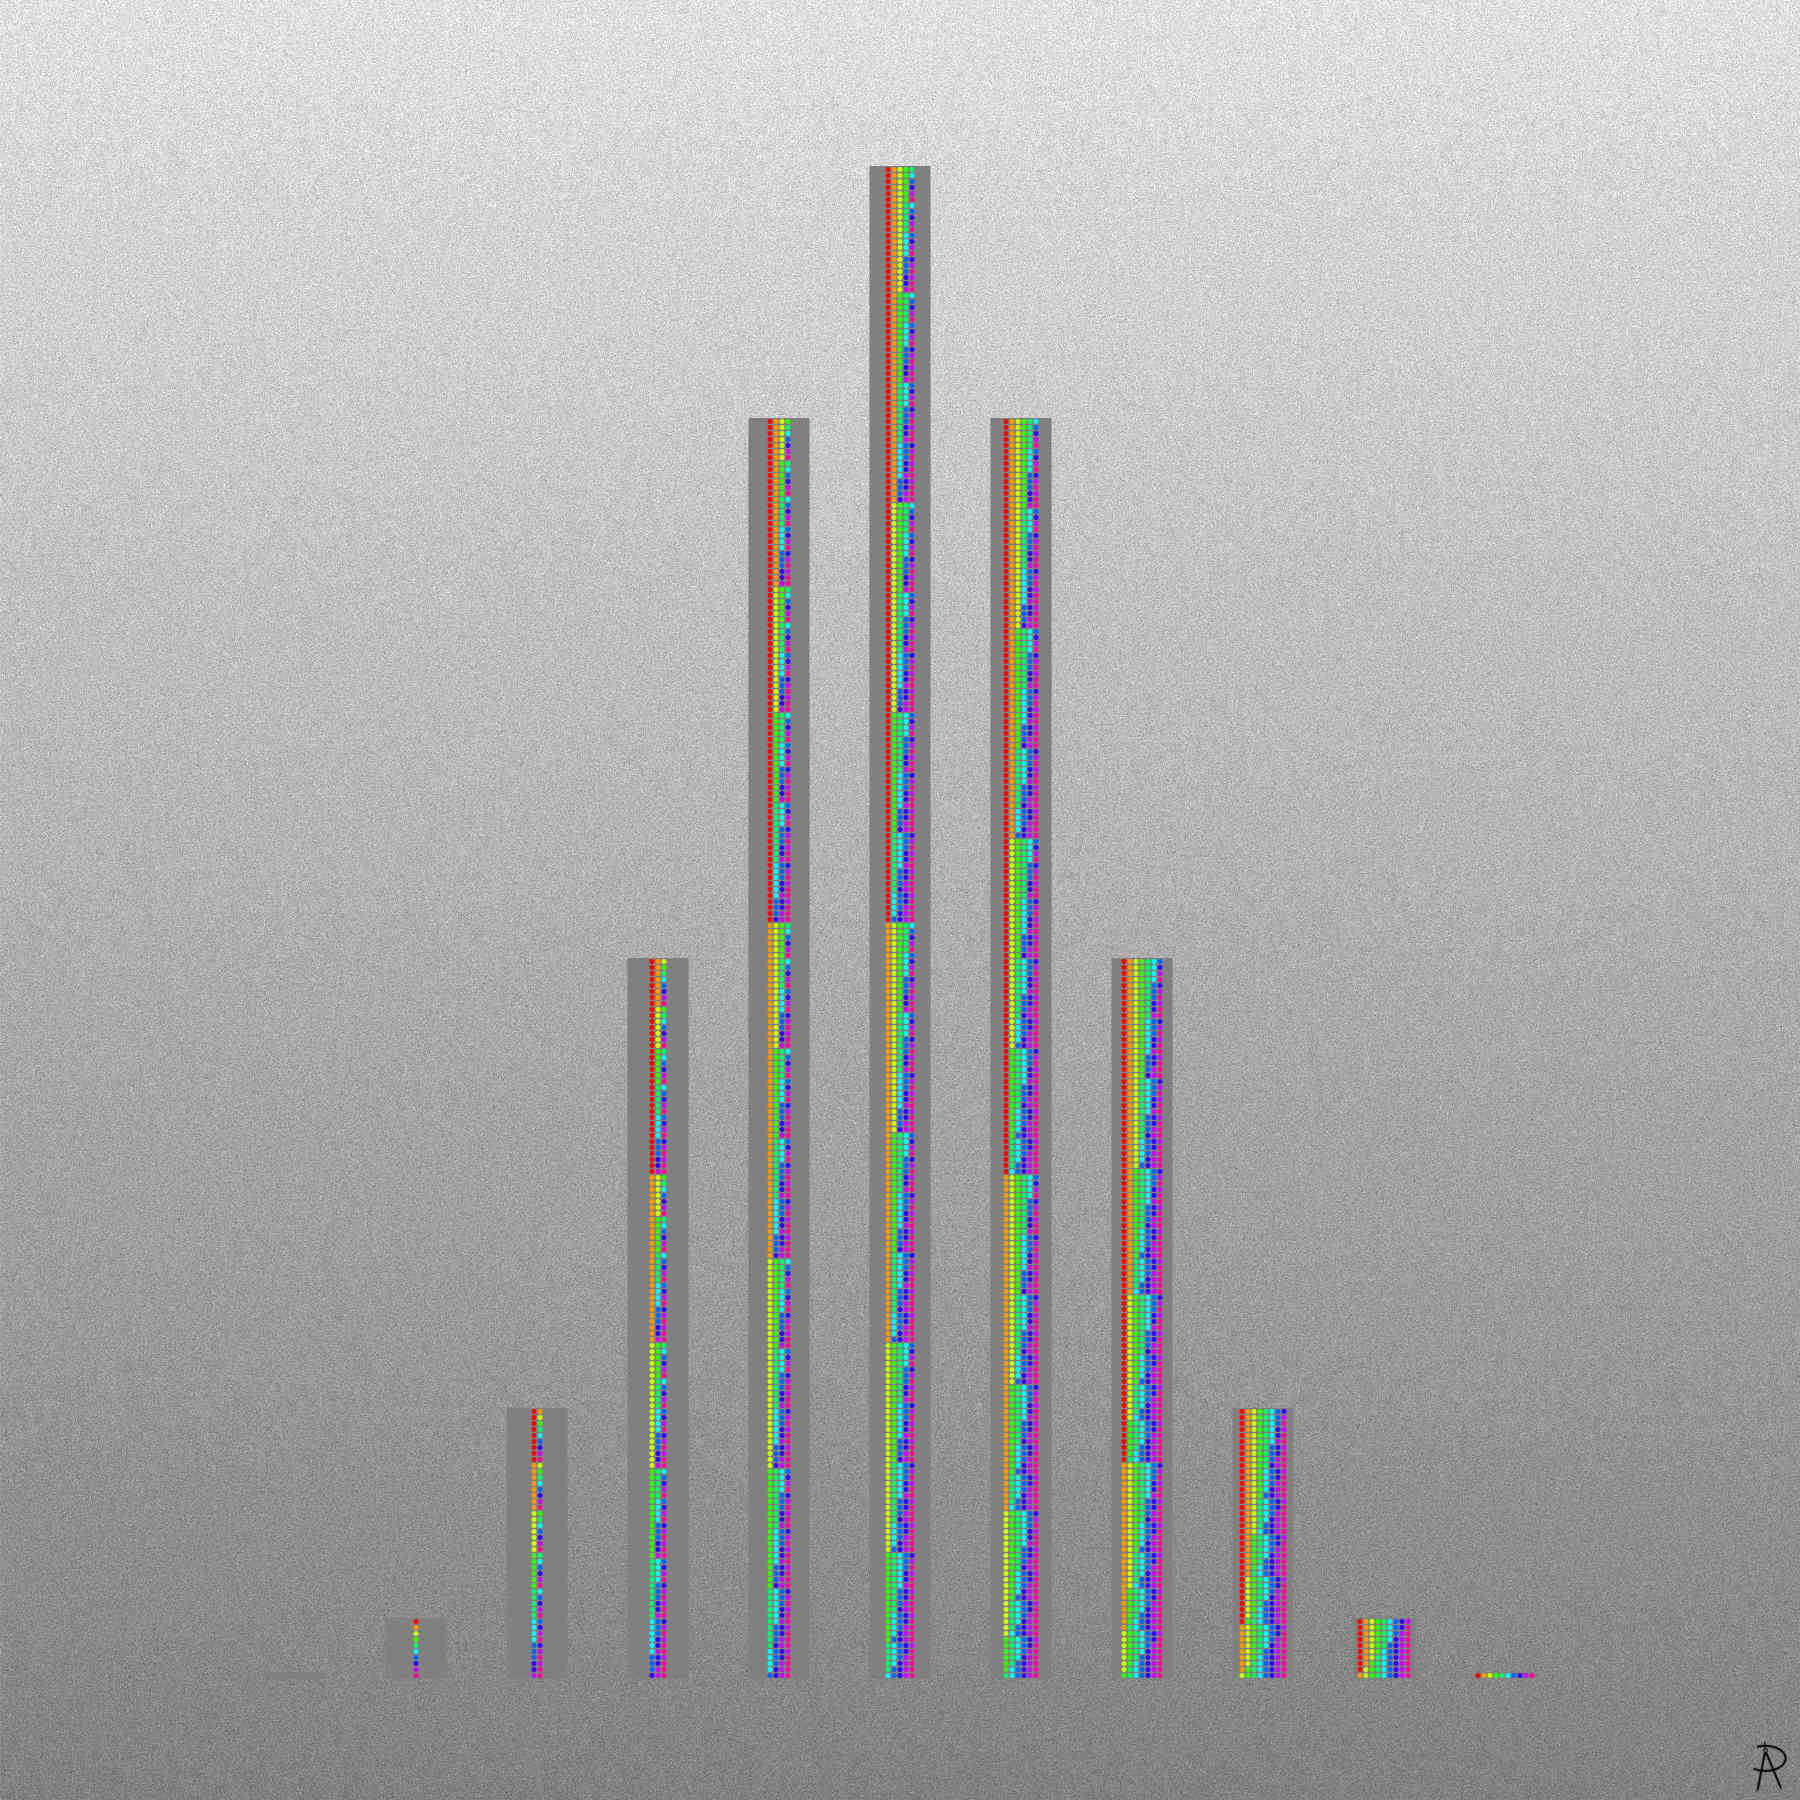
All patterns of choosing items from a set of ten, from zero ( far left) to ten (far right). The patterns are grouped into the 11 possibilities for the number of choices in for a given size. The number in each group is a binomial coefficient related the number of ways to choose \(k\) items from a set of 10 items, resulting in a binomial distribution.
Background and Inspiration
This piece illustrates the way binomial coefficients relate to counting the number of ways of choosing \(k\) items from a set of \(n\) items.
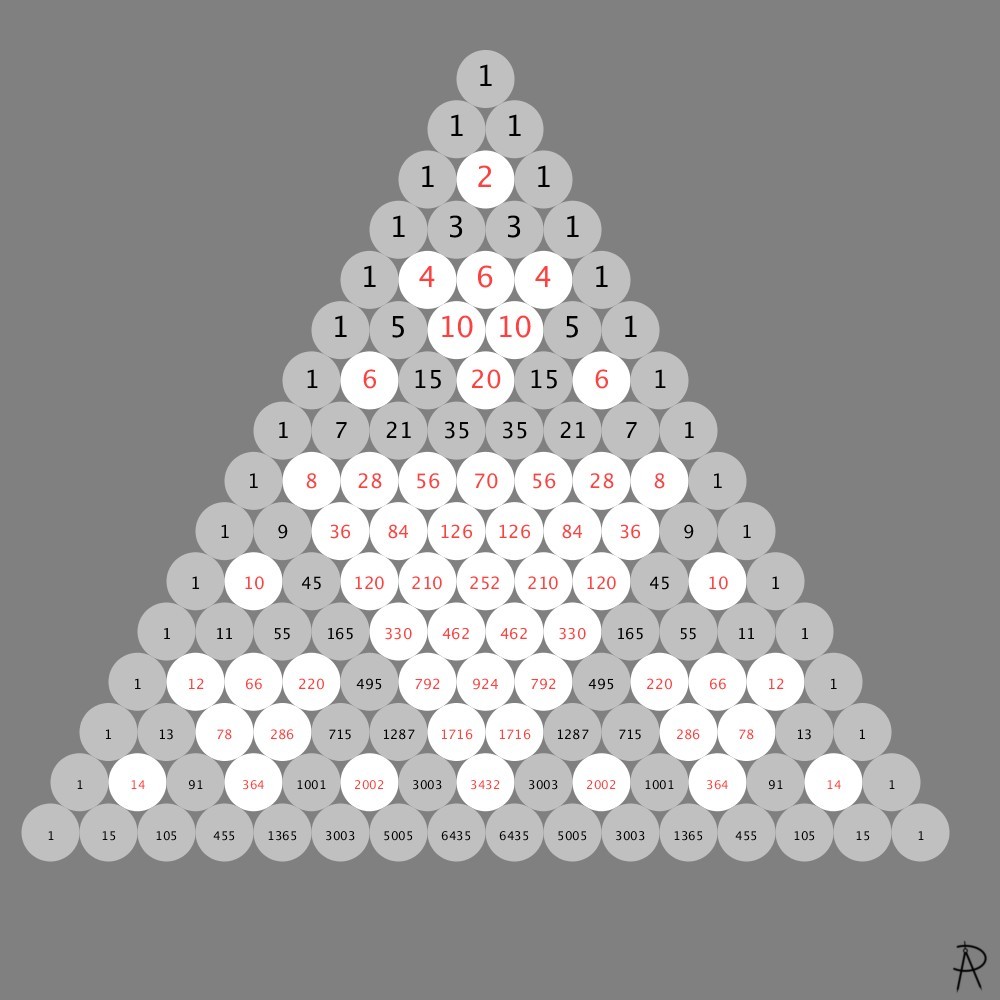
The number of choosing \(k\) items from a set of \(n\) items is given by row \(n\) of Pascal's triangle (see below). This artwork corresponds to \(n = 10\). When \(k\) is 0 or 10, there is only 1 possible pattern (no colors). When \(k\) is 1 or 9, there are 10 possible patterns (all colors). For \(k\) or \(10-k\), equaling 2, 3, 4, and 5, the number of possible patterns are 45, 120, 210, and 252 respectively.
Each row in the column with \(k\) colors can be thought of a set, with \(10 \choose k\) subsets of the set with \(10\) colors. Thus, there are \(2^{10} = 1024\) total subsets that can be made from a set with \(10\) colors.