
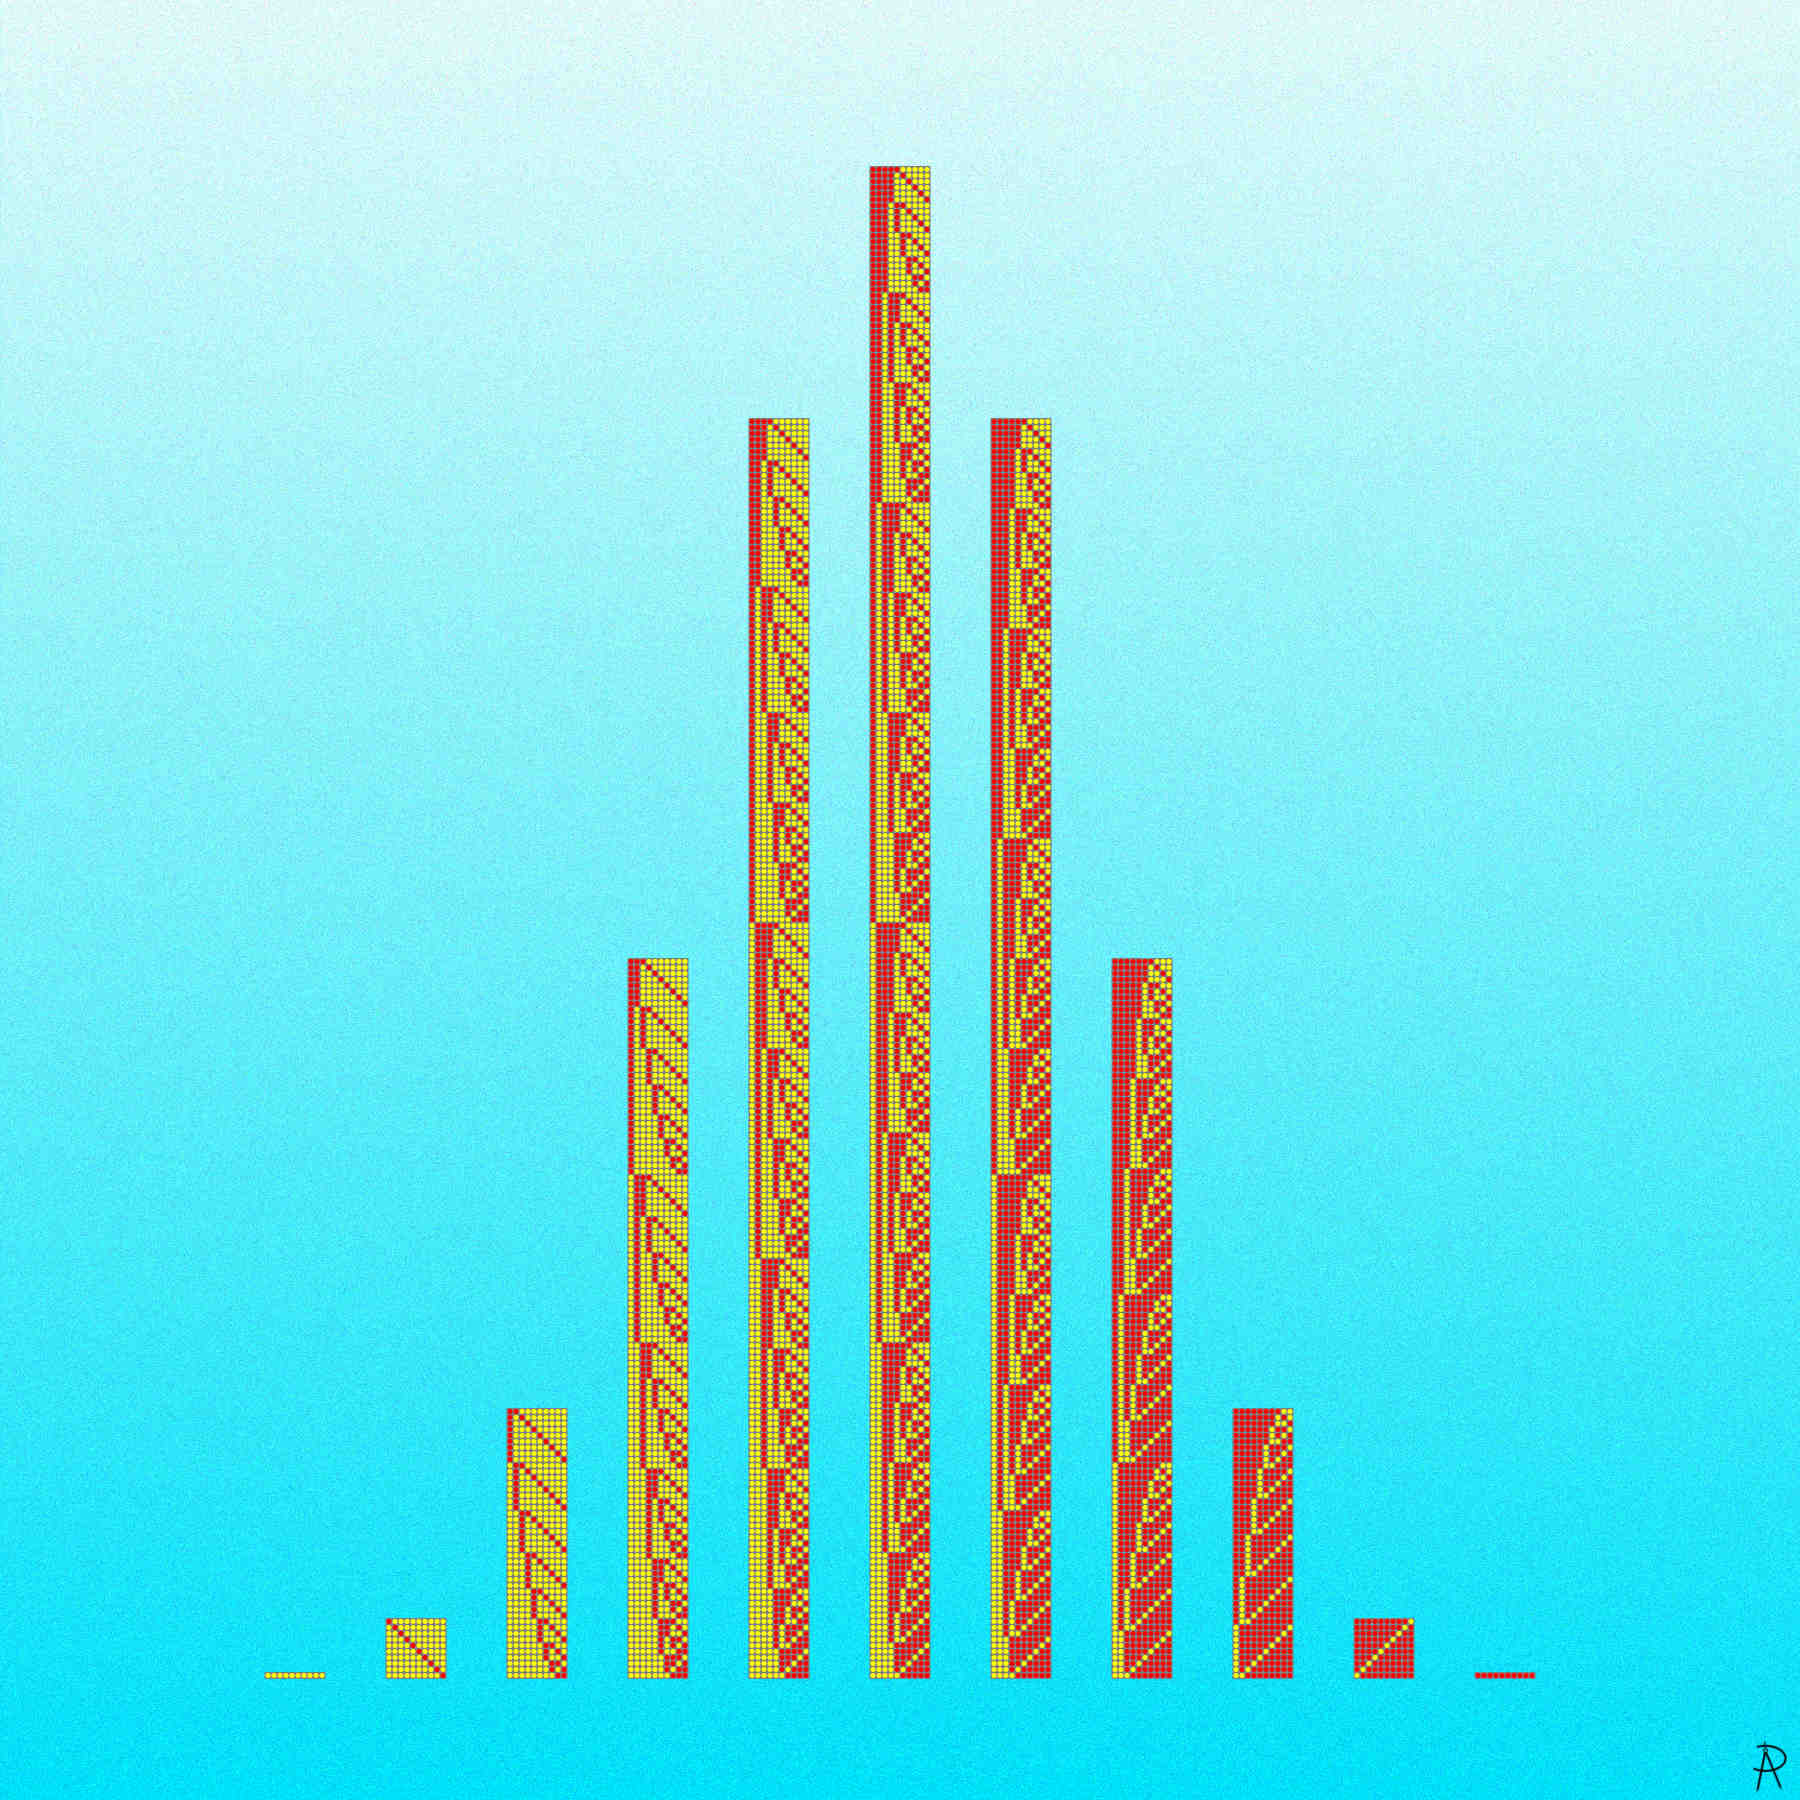
All patterns of 10-bit binary patterns are shown with a one represented by a yellow dot and a zero represented with a red dot. The patterns are grouped into the 11 possibilities for the number of ones (or zeros) in a pattern. The number in each group is a binomial coefficient related the number of ways to choose \(k\) items from a set of 10 items, resulting in a binomial distribution.
Background and Inspiration
This piece is a blend of several key mathematical ideas: Binary numbers that are the heart of modern computers and binomial coefficients that give the number of ways of choosing \(k\) items from a set of \(n\) items.
Binary is used to represent every piece of information processed on modern electronic computers. Computers represent numbers, text, instructions, and other data using binary patterns. A pattern by itself carries no intrinsic meaning. Only the interpretation imparts meaning to a bit pattern. A single bit can represent just two states, but a string of \(n\) bits can represent \(2^n\) different patterns. Because an \(n\)-bit pattern can represent every integer from \(0\) to \(2^n-1\), there are \(2^{10} = 1024\) possible ten bit patterns shown in the artwork.
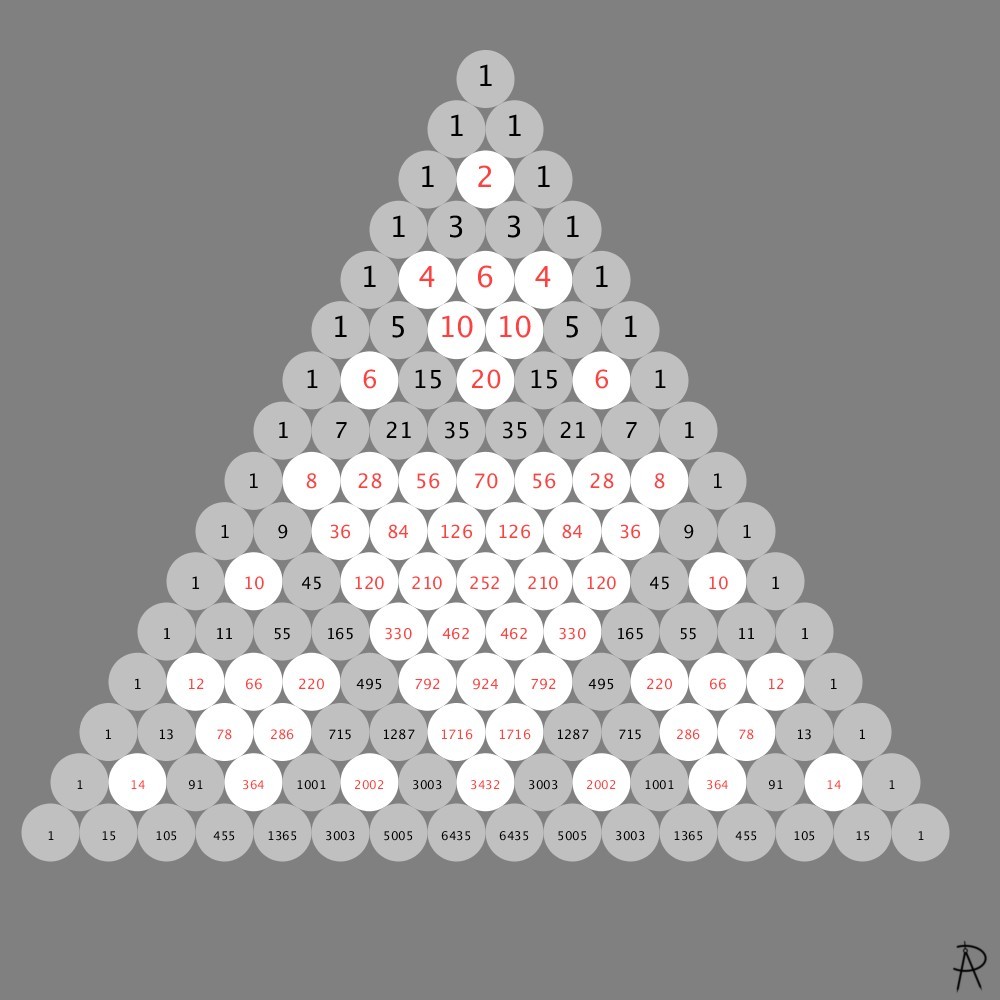
The number of choosing \(k\) items from a set of \(n\) items is given by row \(n\) of Pascal's triangle (see below). This artwork corresponds to \(n = 10\). When \(k\) is 0 or 10, there is only 1 possible pattern. When \(k\) is 1 or 9, there are 10 possible patterns. For \(k\) or \(10-k\) equaling 2, 3, 4, and 5, the number of possible patterns are 45, 120, 210, and 252 respectively.
The columns in the artwork of patterns with \(k\) ones is analogous to the bins in a Galton board with ten rows of pins. A yellow dot represents a bounce to the left and a red dot represents a bounce to the right. With ten bounces, there are \(2^{10}\) possible bounce patterns, resulting in a binomial distribution. Galton used the Galton board to visualize the how the central limit theorem connects the binomial and normal distributions. Thus the heights of the columns show a normal bell shaped curve.

Probability Boardfrom the exhibition Mathematica: A World of Numbers and Beyond designed by Ray and Charles Eames in 1961 and exhibited at the IBM pavilion at the 1964 World's Fair; picture from the Henry Ford Museum of American Innovation (Dearborn, Michigan), 2017. The Mathematica exhibition is also on display in the New York Hall of Science and the Museum of Science in Boston.